Order in Jira. How to start
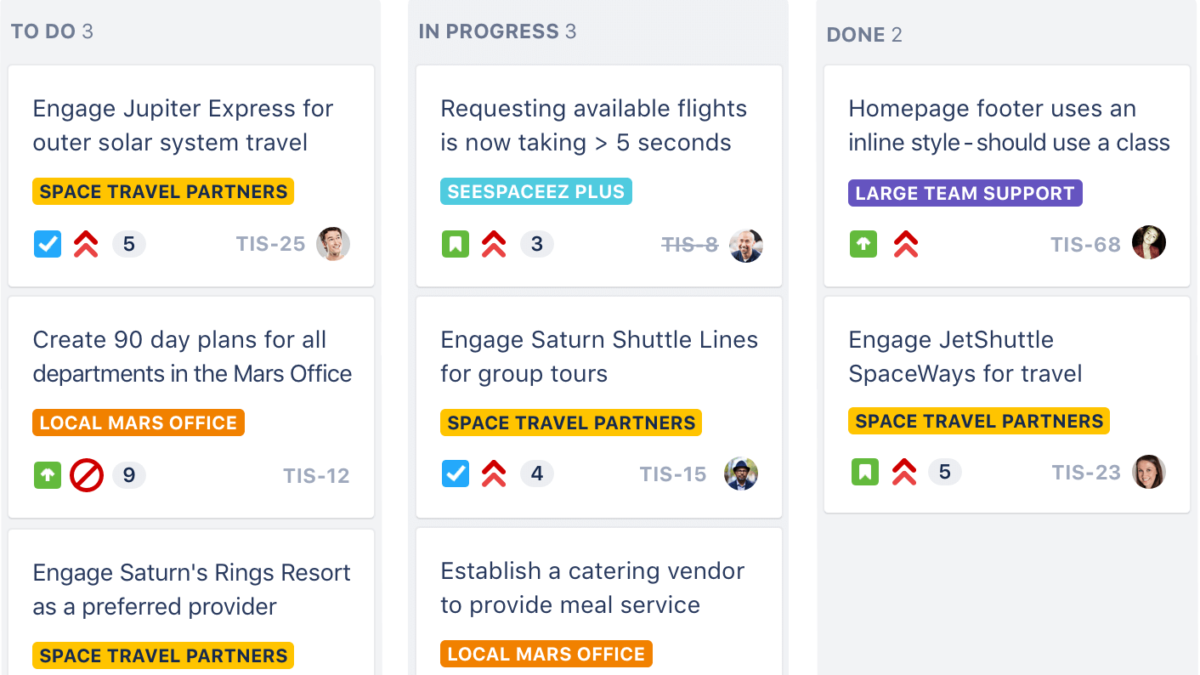
Suddenly, we realize that Jira has become a garbage bin. Every second person configured Jira as it was more convenient for him uncontrollably. And when the project began to burn, it began to extinguish fires manually, leaving the tasks in the tracker in some state, far from complete. If a full-fledged CI / CD is created in the project, then most of the development tasks will be in the correct final status, but the rest …
Some of the projects froze, some fell off, but the tasks in Jira were not cleaned. You have 10-20 ongoing “projects” on hand and you need to quickly understand where is what.
Comparing the experience of the participants at the KiFB gatherings (Francis Bacon Club) in solving this problem, we presented this experience in recorded form (for which thanks to all participants).
In the beginning, you came to an organization with 50+ projects, where a tracker was introduced with a keen desire to establish a systematic project management, including transparent reporting.
An understanding of the state of the project, based on something other than the opinion of the project manager, is invested in objectivity.
Why so? PMs, like most people, are used to being beaten for mistakes. What does PM do? Hides his mistakes until it is too late.
Some of the reports are provided by financial and legal management. Payments, contracts, expenses, acts, etc. But these funds are of little use for the early diagnosis of problems if problems arise in the work process itself. If the workflow is controlled through the task tracker, it is possible to get information from it.
(But of course this works if someone on the production will read these reports, draw conclusions and make decisions for which they are responsible).
Why do I need reports
Report is not needed for report.
A manager facing a mass of data in a mass of reports can fall into a stuck.
The company receives money by performing tasks.
The reports should primarily show the incoming flow of future money, the associated capital, the rate of profit generation and operating expenses. If tracking is used to manage changes, then this is also the rate of change.
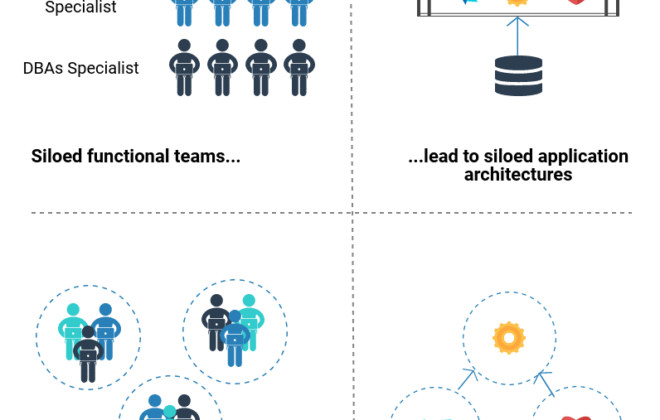
There are different types of activities (taking place jointly and complementing each other): project, process, organizational and research, the analysis of which varies sometime.
Project activities
In fixed-cost projects, it is important to track the rate of combustion of a job. If the work is started as tasks in Jira, reports (which we do not deal with in this article) can help. Another common way is to track the status of a project using a Gantt chart along with a budget plan fact ( tasks in Jira are often forgotten to close).
Research
Research activity does not require the solution of all assigned tasks, on the one hand, and, on the other hand, the tasks solved do not usually generate income. Organizations for which this is not the main activity conduct research in small teams and in shorter cycles, in which management is carried out “somehow” depending on the result. Jira reporting helps a little in managing.
Process activities
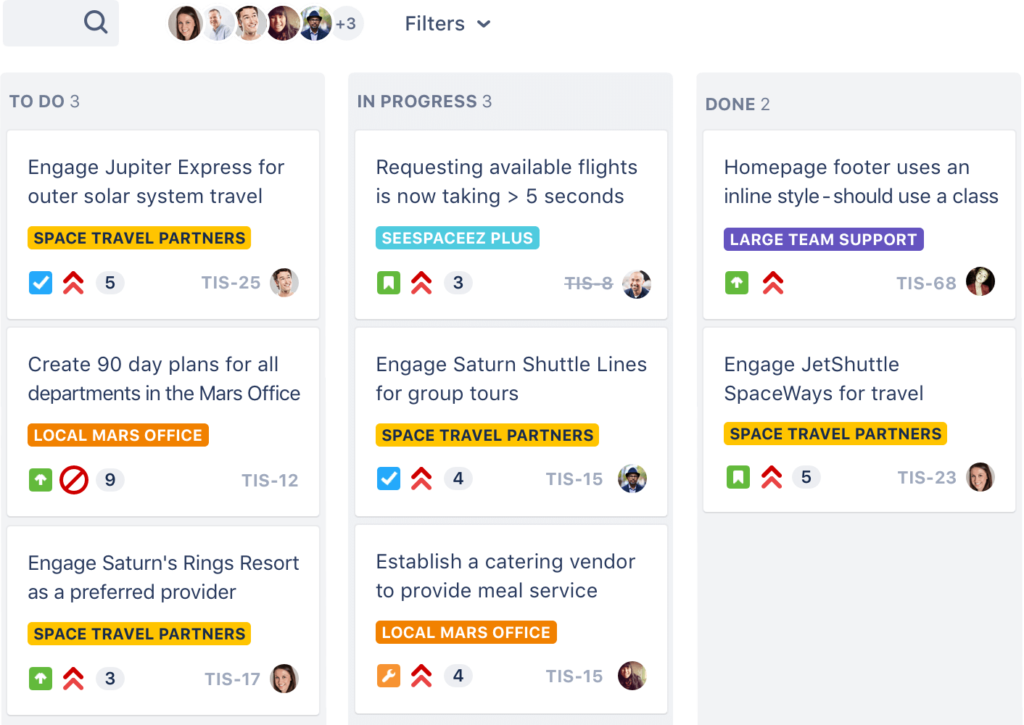
Let’s consider the process activity – this is the execution of the incoming flow of tasks with payment tied to their implementation, while the tasks arrive constantly with some regularity (in other words there is no fixed scope). For example, improvements to the IT system. In this case, reports can directly reflect the status of the process.
The incoming task is future money. Hanging task = hanging money. A problem that is no longer needed = loss of money. The task for which work was performed, but which is not closed = related capital, which can be thrown out if the task goes bad.
How much future income do you have? These are new tasks, with an agreed assessment with the customer. But to see this, you need to clean out obsolete not relevant tasks.
What is the related capital? In sales prices, these are tasks that were taken into work and not completed. In cost prices, this is the labor costs for such tasks in hours or in the value of payroll.
What is the rate of revenue generation? The amount of money to solve the problem in the sprint minus the cost of ownership of the team. But for this it is necessary that the tasks change their status + people note the time spent on the project. However, with this indicator of problems, as a rule, the least arises.
Organizational activity is primarily a change activity.
How fast are you changing? Do you have time to change? This is the speed of organizational tasks and the rate of accumulation of new ones. And reporting on tasks that hung on employees, allowing you to remember to implement the decisions made.
The further path to Lean is supported by more complex reports.
What ideas come to mind:
- Loss of time due to waiting. The ratio of time spent on the time from hiring to implementation. Backlog timeout.
- Losses due to unnecessary transportation. The number of returns over the life cycle with the calculation of the loss of time for waiting in processing
- Losses due to unnecessary processing steps. Downtime due to unnecessary stages in coordinating tasks with supervisors or managers.
- Losses due to excess stocks. Downtime for employees not involved in training, PR or presale.
- Losses due to unnecessary movements. Loss of time organizing meetings, finding contacts, waiting for code to compile, and running unit and other tests.
- Losses due to the release of defective products. The ratio of errors found in the battle against those found on the test. Scope of work to correct errors. The amount of work on alterations due to poor staging.
- Losses of overproduction. Implementation of functionality that did not affect business performance. Losses for testing uncritical or unaffected functionality. Support for obsolete browsers or their versions.
But before these you need to clean the tracker from unnecessary things.