Distributed Logging and Tracing for Microservices
Logging is an important part of any application. Any logging system goes through three main evolutionary steps. The first is output to the console, the second is logging to a file and the appearance of a framework for structured logging, and the third is distributed logging or collecting logs of various services in a single center.
If the logging is well organized, it allows you to understand what, when and how it goes wrong, and to convey the necessary information to people who have to correct these errors. For a system in which 100 thousand messages are sent every second in 10 data centers in 190 countries, and 350 engineers deploy something every day, the logging system is especially important.
To solve the problem of centralized processing and log tracing in microservice architecture under such enormous loads, our company tried various combinations of the ELK, Graylog, Neo4j and MongoDB stack. As a result, after a lot of rake, we wrote our own log service on Elasticsearch, and PostgreSQL was taken as a database for additional information.
To introduce you to the context, I’ll tell you a little about the company. We help client organizations to deliver messages to their clients: messages from a taxi service, SMS from a bank about cancellation, or a one-time password when entering VC. 350 million messages pass through us every day for clients in 190 countries. Each of them we accept, process, bill, route, adapt, send to operators, and in the opposite direction, process delivery reports and generate analytics.
To all this worked in such volumes, we have:
- 36 data centers around the world
- +5000 virtual machines
- 350 Engineers+
- 730 different microservices+
This is a complex system, and no guru will be able to understand the full extent. One of the main goals of our company is the high speed of delivery of new features and releases for business. In this case, everything should work and not fall. We are working on this: 40,000 deployments in 2017, 80,000 in 2018, 300 deployments per day.
We have 350 engineers – it turns out that every engineer deploys something daily. Just a few years ago, only one person in a company had this kind of performance – our principal engineer. But we made sure that every engineer feels as confident as him when he presses the Deploy button or runs a script.
What is needed for this? First of all, confidence that we understand what is happening in the system and in what state it is. Confidence is given by the ability to ask the system a question and find out the cause of the problem during the incident and during the development of the code.
- To achieve this confidence, we invest in observability. Traditionally, this term combines three components:
- logging
- metrics
- trace
We’ll talk about this. First of all, let’s look at our solution for logging, but we will also touch upon metrics and traces.
Evolution
Almost any application or system of logging, including ours, goes through several stages of evolution.
The first step is to output to the console.
The second – we begin to write logs to a file, a framework appears for structured output to a file. We usually use Logback because we work in the JVM. At this stage, structured logging to a file appears, understanding that different logs should have different levels, warnings, errors.
As soon as there are several instances of our service or different services, the task of centralized access to the logs for developers and support appears. We move on to distributed logging – we combine various services into a single logging service.
Distributed Logging
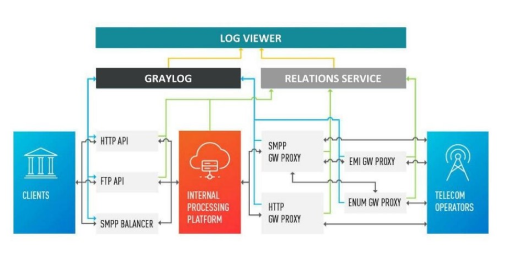
The most famous option is the ELK stack: Elasticsearch, Logstash and Kibana, but we chose Graylog. It has a cool interface that is geared towards logging. Out of the box are alerts already in the free version, which is not in Kibana, for example. For us, this is an excellent choice in terms of logs, and in general it is the same Elasticsearch.
Problems
Our company was growing, and at some point it became clear that something was wrong with Graylog.
Excessive load. There were performance issues. Many developers began to use the cool features of Graylog: they built metrics and dashboards that perform data aggregation. Not the best choice to build sophisticated analytics on the Elasticsearch cluster, which is under heavy recording load.
Collisions. There are many teams, there is no single scheme. Traditionally, when one ID first hit Graylog as a long, mapping automatically occurred. If another team decides that there should be written the UUID as a string this will break the system.
First decision
Separated application logs and communication logs. Different logs have different scenarios and methods of application. There are, for example, application logs for which different teams have different requirements for different parameters: by the storage time in the system, by the speed of search.
Therefore, the first thing we did was to separate application logs and communication logs. The second type is important logs that store information about the interaction of our platform with the outside world and about the interaction within the platform. We will talk more about this.
Replaced a substantial part of the logs with metrics. In our company, the standard choice is Prometheus and Grafana. Some teams use other solutions. But it is important that we got rid of a large number of dashboards with aggregations inside Graylog, transferred everything to Prometheus and Grafana. This greatly eased the load on the servers.
Let’s look at the scenarios for applying logs, metrics and traces.
Logs
High dimensionality, debugging and research. What are good logs?
They can have a large dimension: you can log Request ID, User ID, request attributes and other data, the dimension of which is not limited. They are also good for debugging and research, to ask the system questions about what happened and look for causes and effects.
Related Posts
Leave a Reply Cancel reply
Service
Categories
- DEVELOPMENT (123)
- DEVOPS (54)
- FRAMEWORKS (46)
- IT (25)
- QA (14)
- SECURITY (15)
- SOFTWARE (13)
- UI/UX (6)
- Uncategorized (8)


