Clickhouse next to Zabbix or how to collect logs with monitoring
- Monitoring of infrastructure objects is carried out in Zabbix with a correlation of incoming flows in Monq.
- Some time passes and an event from Zabbix comes to Monq, stating that the authentication service is not available.
- Why? What happened? We open the Monq primary events screen, and there is already a flurry of events from the Nginx-ingress-controller
- Using the analytical tools of the primary screen, we find out that we have a 503 error. In 30 minutes, there are already 598 records of 31.31% of the total number of logs from the Nginx-ingress controller.
- From the same window, filter events, click on the error value and select “add to filter”. As a result, the source.code = 503 parameter will be added to the filter panel. Excessive log data will be removed from the screen.
- We turn to the analysis of structured logs and see at which URL the error is returned, understand which microservice is failing and quickly solve the problem by re-creating the container.
- For the future, we start logs from this container in Monq, and next time we know much more information about the problem that can be passed on to developers to edit the code.
Alerting and automation will soon appear in the free functionality of Monq Collector, which will allow such errors to be immediately triggered. So far, this functionality is only available in the paid Monq AIOps.
The case that I gave above is, of course, not from real life, but more a demonstration of general principles. In life, things are often not so obvious. From practice:
2019, we are developing a system in which 50+ containers. In each release, our release master spent a lot of time figuring out why the intermicroservice interaction could break. Moving between microservices and logs, each time typing kubectl get log, in one window, the same thing in the second window, then in the third. And you also need to tail the web server logs. Then I remembered that in the first window, etc. And then the team is growing, to give everyone access via ssh to the server? No, you need an aggregator.
We set up sending logs to ELK, collected everything that was needed, and then something happened. In ELK, each event source uses its own index and this is not very convenient. The team kept growing, outsourcers appeared, we realized that we needed to differentiate the rights of working groups. The number of logs began to grow strongly, the clustering of the database by its own means without the use of a tambourine began to be needed, a highload is needed. At ELK, all this is already for money. We decided to send the logs to the Monq Collector.
2021 year. The next release, everyone rolled out, Kuber launched containers, Zabbix alarm that authorization does not work, go to Collector, parse by fields, we see where the problem is. We see from the logs that it started at this time, after the rollout of that. The problem was solved quickly and easily, and this is on the volume of more than 200 GB of logs per day, when more than 30 people work with the storage. And this is a real profit.
- We send logs to the collector using fluent-bit too (the Monq collector will have its own extractor in August, I will write about it later)
|
1 2 3 4 5 6 7 8 9 10 11 |
[OUTPUT] Name http Host monq.example.ru Match * URI /api/public/cl/v1/stream-data Header x-smon-stream-key 06697f2c-2d23-45eb-b067-aeb49ff7591d Header Content-Type application/x-ndjson Format json_lines Json_date_key @timestamp Json_date_format iso8601 allow_duplicated_headers false |
- Monitoring of infrastructure objects is carried out in Zabbix with a correlation of incoming flows in Monq.
- Some time passes and an event from Zabbix comes to Monq, stating that the authentication service is not available.
- Why? What happened? We open the Monq primary events screen, and there is already a flurry of events from the Nginx-ingress-controller
- Using the analytical tools of the primary screen, we find out that we have a 503 error. In 30 minutes, there are already 598 records of 31.31% of the total number of logs from the Nginx-ingress controller.
- From the same window, filter events, click on the error value and select “add to filter”. As a result, the source.code = 503 parameter will be added to the filter panel. Excessive log data will be removed from the screen.
- We turn to the analysis of structured logs and see at which URL the error is returned, understand which microservice is failing and quickly solve the problem by re-creating the container.
- For the future, we start logs from this container in Monq, and next time we know much more information about the problem that can be passed on to developers to edit the code.
Alerting and automation will soon appear in the free functionality of Monq Collector, which will allow such errors to be immediately triggered. So far, this functionality is only available in the paid Monq AIOps.
The case that I gave above is, of course, not from real life, but more a demonstration of general principles. In life, things are often not so obvious. From practice:
2019, we are developing a system in which 50+ containers. In each release, our release master spent a lot of time figuring out why the intermicroservice interaction could break. Moving between microservices and logs, each time typing kubectl get log, in one window, the same thing in the second window, then in the third. And you also need to tail the web server logs. Then I remembered that in the first window, etc. And then the team is growing, to give everyone access via ssh to the server? No, you need an aggregator.
We set up sending logs to ELK, collected everything that was needed, and then something happened. In ELK, each event source uses its own index and this is not very convenient. The team kept growing, outsourcers appeared, we realized that we needed to differentiate the rights of working groups. The number of logs began to grow strongly, the clustering of the database by its own means without the use of a tambourine began to be needed, a highload is needed. At ELK, all this is already for money. We decided to send the logs to the Monq Collector.
2021 year. The next release, everyone rolled out, Kuber launched containers, Zabbix alarm that authorization does not work, go to Collector, parse by fields, we see where the problem is. We see from the logs that it started at this time, after the rollout of that. The problem was solved quickly and easily, and this is on the volume of more than 200 GB of logs per day, when more than 30 people work with the storage. And this is a real profit.
- Set up the collection of logs from the Nginx-ingress controller, which is located in a cluster running Kubernetes.
In this case, we will transfer logs to the collector using the fluent-bit utility. Here are the listings of configuration files:
|
1 2 3 4 5 6 7 8 9 |
[INPUT] Name tail Tag nginx-ingress.* Path /var/log/containers/nginx*.log Parser docker DB /var/log/flb_kube.db Mem_Buf_Limit 10MB Skip_Long_Lines On Refresh_Interval 10 |
Let’s prepare parsers for Nginx to convert raw to JSON:
|
1 2 3 4 5 6 7 8 9 10 11 12 13 14 15 16 17 18 19 20 |
[PARSER] Name nginx Format regex Regex ^(?<remote>[^ ]*) (?<host>[^ ]*) (?<user>[^ ]*) \[(?<time>[^\]]*)\] "(?<method>\S+)(?: +(?<path>[^\"]*?)(?: +\S*)?)?" (?<code>[^ ]*) (?<size>[^ ]*)(?: "(?< Time_Key time Time_Format %d/%b/%Y:%H:%M:%S %z .... [PARSER] Name nginx-upstream Format regex Regex ^(?<remote>.*) \- \[(?<realip>.*)\] \- (?<user>.*) \[(?<time>[^\]]*)\] "(?:(?<method>\S+[^\"])(?: +(?<path>[^\"]*?)(?: +(?<protocol>\S*))?)?)?" (?<code>[^ Time_Key time Time_Format %d/%b/%Y:%H:%M:%S %z [PARSER] Name nginx-error Format regex Regex ^(?<time>\d{4}\/\d{2}\/\d{2} \d{2}:\d{2}:\d{2}) \[(?<log_level>\w+)\] (?<pid>\d+).(?<tid>\d+): (?<message>.*), client: (?<client>.*), server: (?<server>.*) Time_Key time Time_Format %Y/%m/%d %H:%M:%S |
- We send logs to the collector using fluent-bit too (the Monq collector will have its own extractor in August, I will write about it later)
- Monitoring of infrastructure objects is carried out in Zabbix with a correlation of incoming flows in Monq.
- Some time passes and an event from Zabbix comes to Monq, stating that the authentication service is not available.
- Why? What happened? We open the Monq primary events screen, and there is already a flurry of events from the Nginx-ingress-controller
- Using the analytical tools of the primary screen, we find out that we have a 503 error. In 30 minutes, there are already 598 records of 31.31% of the total number of logs from the Nginx-ingress controller.
- From the same window, filter events, click on the error value and select “add to filter”. As a result, the source.code = 503 parameter will be added to the filter panel. Excessive log data will be removed from the screen.
- We turn to the analysis of structured logs and see at which URL the error is returned, understand which microservice is failing and quickly solve the problem by re-creating the container.
- For the future, we start logs from this container in Monq, and next time we know much more information about the problem that can be passed on to developers to edit the code.
Alerting and automation will soon appear in the free functionality of Monq Collector, which will allow such errors to be immediately triggered. So far, this functionality is only available in the paid Monq AIOps.
The case that I gave above is, of course, not from real life, but more a demonstration of general principles. In life, things are often not so obvious. From practice:
2019, we are developing a system in which 50+ containers. In each release, our release master spent a lot of time figuring out why the intermicroservice interaction could break. Moving between microservices and logs, each time typing kubectl get log, in one window, the same thing in the second window, then in the third. And you also need to tail the web server logs. Then I remembered that in the first window, etc. And then the team is growing, to give everyone access via ssh to the server? No, you need an aggregator.
We set up sending logs to ELK, collected everything that was needed, and then something happened. In ELK, each event source uses its own index and this is not very convenient. The team kept growing, outsourcers appeared, we realized that we needed to differentiate the rights of working groups. The number of logs began to grow strongly, the clustering of the database by its own means without the use of a tambourine began to be needed, a highload is needed. At ELK, all this is already for money. We decided to send the logs to the Monq Collector.
2021 year. The next release, everyone rolled out, Kuber launched containers, Zabbix alarm that authorization does not work, go to Collector, parse by fields, we see where the problem is. We see from the logs that it started at this time, after the rollout of that. The problem was solved quickly and easily, and this is on the volume of more than 200 GB of logs per day, when more than 30 people work with the storage. And this is a real profit.
Let’s try to describe a small fictional use case.
We have a cluster running Kubernetes. There are several virtual machines for rent. All nodes are monitored using Zabbix. And there is an authorization service, which is very important for us, since several corporate services work through it.
Zabbix periodically reports that the authorization service is unavailable, then it is available again in a minute or two.
We want to find the reason for the drop in service and not flinch from every notification of the phone
Zabbix is an excellent monitoring tool, but it is not enough for incident investigation. Errors can often lie in the logs. And for this we will collect and analyze logs in the Monq Collector.
So step by step:
- Set up the collection of logs from the Nginx-ingress controller, which is located in a cluster running Kubernetes.
In this case, we will transfer logs to the collector using the fluent-bit utility. Here are the listings of configuration files:
[crayon-6a5ef83c4811c228063044/]Let’s prepare parsers for Nginx to convert raw to JSON:
[crayon-6a5ef83c48120099466664/]- We send logs to the collector using fluent-bit too (the Monq collector will have its own extractor in August, I will write about it later)
- Monitoring of infrastructure objects is carried out in Zabbix with a correlation of incoming flows in Monq.
- Some time passes and an event from Zabbix comes to Monq, stating that the authentication service is not available.
- Why? What happened? We open the Monq primary events screen, and there is already a flurry of events from the Nginx-ingress-controller
- Using the analytical tools of the primary screen, we find out that we have a 503 error. In 30 minutes, there are already 598 records of 31.31% of the total number of logs from the Nginx-ingress controller.
- From the same window, filter events, click on the error value and select “add to filter”. As a result, the source.code = 503 parameter will be added to the filter panel. Excessive log data will be removed from the screen.
- We turn to the analysis of structured logs and see at which URL the error is returned, understand which microservice is failing and quickly solve the problem by re-creating the container.
- For the future, we start logs from this container in Monq, and next time we know much more information about the problem that can be passed on to developers to edit the code.
Alerting and automation will soon appear in the free functionality of Monq Collector, which will allow such errors to be immediately triggered. So far, this functionality is only available in the paid Monq AIOps.
The case that I gave above is, of course, not from real life, but more a demonstration of general principles. In life, things are often not so obvious. From practice:
2019, we are developing a system in which 50+ containers. In each release, our release master spent a lot of time figuring out why the intermicroservice interaction could break. Moving between microservices and logs, each time typing kubectl get log, in one window, the same thing in the second window, then in the third. And you also need to tail the web server logs. Then I remembered that in the first window, etc. And then the team is growing, to give everyone access via ssh to the server? No, you need an aggregator.
We set up sending logs to ELK, collected everything that was needed, and then something happened. In ELK, each event source uses its own index and this is not very convenient. The team kept growing, outsourcers appeared, we realized that we needed to differentiate the rights of working groups. The number of logs began to grow strongly, the clustering of the database by its own means without the use of a tambourine began to be needed, a highload is needed. At ELK, all this is already for money. We decided to send the logs to the Monq Collector.
2021 year. The next release, everyone rolled out, Kuber launched containers, Zabbix alarm that authorization does not work, go to Collector, parse by fields, we see where the problem is. We see from the logs that it started at this time, after the rollout of that. The problem was solved quickly and easily, and this is on the volume of more than 200 GB of logs per day, when more than 30 people work with the storage. And this is a real profit.
- bind Zabbix nodes and triggers to resource-service model in Monq
- automatically create correlation rules (synthetic triggers) Monq with preset filters and rules for events coming from Zabbix triggers
- work with low-level discovery (LLD) in Zabbix.
Synthetic triggers allow you to handle any event that goes into the Monq monitoring system. It is possible to create triggers from a template or customize it from scratch using scripts written in the Lua language in the IDE editor built into the web interface.
Using the Zabbix connector in Monq , you can drag and drop the entire infrastructure and build a resource-service model of the entire information system. This is convenient when you need to quickly find the localization of the problem, the cause of the incident.
The question is brewing, is it possible to differentiate access to logs to certain categories of persons? For example, so that information security logs are available to a certain category of persons? Yes.
To do this, Monq Collector has built a very flexible role model using workgroups. System users can simultaneously have different roles in different workgroups. By connecting the data stream, we can allow read or write access to certain roles and assign these roles to users.
How does this help me?
Let’s try to describe a small fictional use case.
We have a cluster running Kubernetes. There are several virtual machines for rent. All nodes are monitored using Zabbix. And there is an authorization service, which is very important for us, since several corporate services work through it.
Zabbix periodically reports that the authorization service is unavailable, then it is available again in a minute or two.
We want to find the reason for the drop in service and not flinch from every notification of the phone
Zabbix is an excellent monitoring tool, but it is not enough for incident investigation. Errors can often lie in the logs. And for this we will collect and analyze logs in the Monq Collector.
So step by step:
- Set up the collection of logs from the Nginx-ingress controller, which is located in a cluster running Kubernetes.
In this case, we will transfer logs to the collector using the fluent-bit utility. Here are the listings of configuration files:
[crayon-6a5ef83c4811c228063044/]Let’s prepare parsers for Nginx to convert raw to JSON:
[crayon-6a5ef83c48120099466664/]- We send logs to the collector using fluent-bit too (the Monq collector will have its own extractor in August, I will write about it later)
- Monitoring of infrastructure objects is carried out in Zabbix with a correlation of incoming flows in Monq.
- Some time passes and an event from Zabbix comes to Monq, stating that the authentication service is not available.
- Why? What happened? We open the Monq primary events screen, and there is already a flurry of events from the Nginx-ingress-controller
- Using the analytical tools of the primary screen, we find out that we have a 503 error. In 30 minutes, there are already 598 records of 31.31% of the total number of logs from the Nginx-ingress controller.
- From the same window, filter events, click on the error value and select “add to filter”. As a result, the source.code = 503 parameter will be added to the filter panel. Excessive log data will be removed from the screen.
- We turn to the analysis of structured logs and see at which URL the error is returned, understand which microservice is failing and quickly solve the problem by re-creating the container.
- For the future, we start logs from this container in Monq, and next time we know much more information about the problem that can be passed on to developers to edit the code.
Alerting and automation will soon appear in the free functionality of Monq Collector, which will allow such errors to be immediately triggered. So far, this functionality is only available in the paid Monq AIOps.
The case that I gave above is, of course, not from real life, but more a demonstration of general principles. In life, things are often not so obvious. From practice:
2019, we are developing a system in which 50+ containers. In each release, our release master spent a lot of time figuring out why the intermicroservice interaction could break. Moving between microservices and logs, each time typing kubectl get log, in one window, the same thing in the second window, then in the third. And you also need to tail the web server logs. Then I remembered that in the first window, etc. And then the team is growing, to give everyone access via ssh to the server? No, you need an aggregator.
We set up sending logs to ELK, collected everything that was needed, and then something happened. In ELK, each event source uses its own index and this is not very convenient. The team kept growing, outsourcers appeared, we realized that we needed to differentiate the rights of working groups. The number of logs began to grow strongly, the clustering of the database by its own means without the use of a tambourine began to be needed, a highload is needed. At ELK, all this is already for money. We decided to send the logs to the Monq Collector.
2021 year. The next release, everyone rolled out, Kuber launched containers, Zabbix alarm that authorization does not work, go to Collector, parse by fields, we see where the problem is. We see from the logs that it started at this time, after the rollout of that. The problem was solved quickly and easily, and this is on the volume of more than 200 GB of logs per day, when more than 30 people work with the storage. And this is a real profit.
- vector computing;
- parallelization of operations;
- columnar data storage;
- support for approximate calculations;
- physical sorting of data by primary key.
But one of the most important features of ClickHouse is a very efficient saving of storage space. The average compression ratio is 1:20, which is a very good result.
Native connector with Zabbix
If you paid attention to the title of the article, then initially we wanted to tell you what is good about using Monq in companies where Zabbix is used as an infrastructure monitoring system.
Firstly, the product for collecting and analyzing logs is provided absolutely free of charge and without any restrictions on traffic and time.
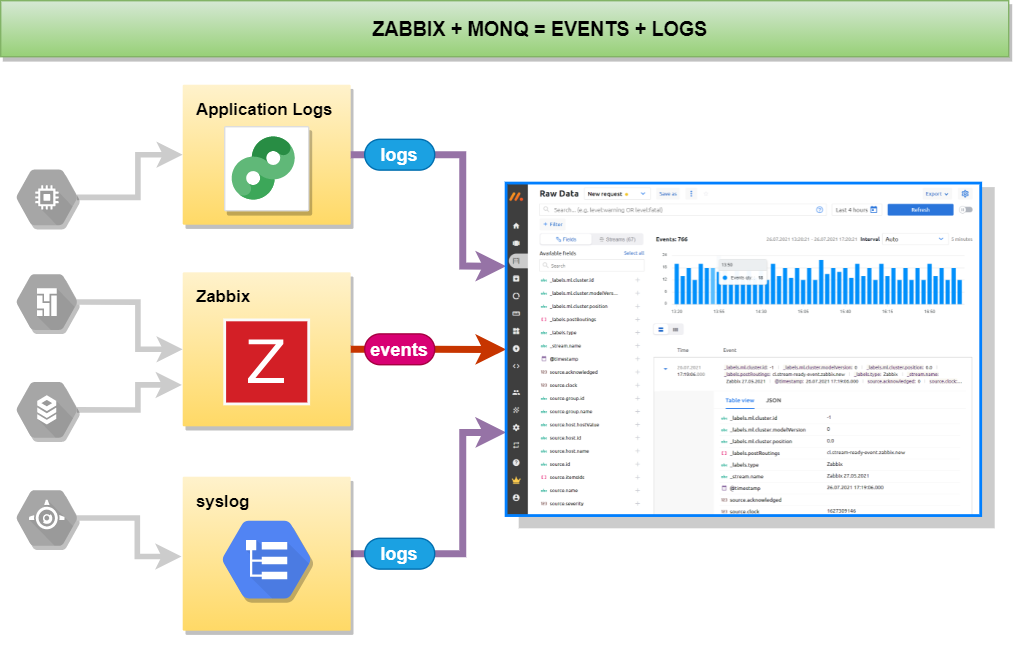
Secondly, the Monq Collector includes a built-in connector with Zabbix, which allows you to receive all events from Zabbix triggers and then view them on the same screen with the logs.
To receive events from Zabbix and other systems such as Nagios, Prometheus, SCOM, Ntopng, system handlers are provided, with the ability to customize the code or write your own handlers.
For example, you can convert the date format to a convenient format:
|
1 2 3 4 5 6 7 8 9 10 11 12 13 14 15 16 17 18 19 20 21 22 23 24 25 26 27 28 29 30 31 |
unction is_array(t) local i = 0 for _ in pairs(t) do i = i + 1 if t[i] == nil then return false end end return true end function convert_date_time(date_string) local pattern = "(%d+)%-(%d+)%-(%d+)(%a)(%d+)%:(%d+)%:([%d%.]+)([Z%p])(%d*)%:?(%d*)"; local xyear, xmonth, xday, xdelimit, xhour, xminute, xseconds, xoffset, xoffsethour, xoffsetmin xyear, xmonth, xday, xdelimit, xhour, xminute, xseconds, xoffset, xoffsethour, xoffsetmin = string.match(date_string,pattern) return string.format("%s-%s-%s%s%s:%s:%s%s", xyear, xmonth, xday, xdelimit, xhour, xminute, string.sub(xseconds, 1, 8), xoffset) end function alerts_parse(result_alerts, source_json) for key, alert in pairs(source_json.alerts) do alert["startsAt"]=convert_date_time(alert["startsAt"]) alert["endsAt"]=convert_date_time(alert["endsAt"]) result_alerts[#result_alerts+1]=alert end end local sources_json = json.decode(source) result_alerts = {}; if (is_array(sources_json)) then for key, source_json in pairs(sources_json) do alerts_parse(result_alerts, source_json) end else alerts_parse(result_alerts, sources_json) end next_step(json.encode(result_alerts)) |
Thirdly, if you install a trial or a paid add-on Monq AIOps, then a number of native Zabbix and Monq communication functions appear, which allow you to:
- bind Zabbix nodes and triggers to resource-service model in Monq
- automatically create correlation rules (synthetic triggers) Monq with preset filters and rules for events coming from Zabbix triggers
- work with low-level discovery (LLD) in Zabbix.
Synthetic triggers allow you to handle any event that goes into the Monq monitoring system. It is possible to create triggers from a template or customize it from scratch using scripts written in the Lua language in the IDE editor built into the web interface.
Using the Zabbix connector in Monq , you can drag and drop the entire infrastructure and build a resource-service model of the entire information system. This is convenient when you need to quickly find the localization of the problem, the cause of the incident.
The question is brewing, is it possible to differentiate access to logs to certain categories of persons? For example, so that information security logs are available to a certain category of persons? Yes.
To do this, Monq Collector has built a very flexible role model using workgroups. System users can simultaneously have different roles in different workgroups. By connecting the data stream, we can allow read or write access to certain roles and assign these roles to users.
How does this help me?
Let’s try to describe a small fictional use case.
We have a cluster running Kubernetes. There are several virtual machines for rent. All nodes are monitored using Zabbix. And there is an authorization service, which is very important for us, since several corporate services work through it.
Zabbix periodically reports that the authorization service is unavailable, then it is available again in a minute or two.
We want to find the reason for the drop in service and not flinch from every notification of the phone
Zabbix is an excellent monitoring tool, but it is not enough for incident investigation. Errors can often lie in the logs. And for this we will collect and analyze logs in the Monq Collector.
So step by step:
- Set up the collection of logs from the Nginx-ingress controller, which is located in a cluster running Kubernetes.
In this case, we will transfer logs to the collector using the fluent-bit utility. Here are the listings of configuration files:
[crayon-6a5ef83c4811c228063044/]Let’s prepare parsers for Nginx to convert raw to JSON:
[crayon-6a5ef83c48120099466664/]- We send logs to the collector using fluent-bit too (the Monq collector will have its own extractor in August, I will write about it later)
- Monitoring of infrastructure objects is carried out in Zabbix with a correlation of incoming flows in Monq.
- Some time passes and an event from Zabbix comes to Monq, stating that the authentication service is not available.
- Why? What happened? We open the Monq primary events screen, and there is already a flurry of events from the Nginx-ingress-controller
- Using the analytical tools of the primary screen, we find out that we have a 503 error. In 30 minutes, there are already 598 records of 31.31% of the total number of logs from the Nginx-ingress controller.
- From the same window, filter events, click on the error value and select “add to filter”. As a result, the source.code = 503 parameter will be added to the filter panel. Excessive log data will be removed from the screen.
- We turn to the analysis of structured logs and see at which URL the error is returned, understand which microservice is failing and quickly solve the problem by re-creating the container.
- For the future, we start logs from this container in Monq, and next time we know much more information about the problem that can be passed on to developers to edit the code.
Alerting and automation will soon appear in the free functionality of Monq Collector, which will allow such errors to be immediately triggered. So far, this functionality is only available in the paid Monq AIOps.
The case that I gave above is, of course, not from real life, but more a demonstration of general principles. In life, things are often not so obvious. From practice:
2019, we are developing a system in which 50+ containers. In each release, our release master spent a lot of time figuring out why the intermicroservice interaction could break. Moving between microservices and logs, each time typing kubectl get log, in one window, the same thing in the second window, then in the third. And you also need to tail the web server logs. Then I remembered that in the first window, etc. And then the team is growing, to give everyone access via ssh to the server? No, you need an aggregator.
We set up sending logs to ELK, collected everything that was needed, and then something happened. In ELK, each event source uses its own index and this is not very convenient. The team kept growing, outsourcers appeared, we realized that we needed to differentiate the rights of working groups. The number of logs began to grow strongly, the clustering of the database by its own means without the use of a tambourine began to be needed, a highload is needed. At ELK, all this is already for money. We decided to send the logs to the Monq Collector.
2021 year. The next release, everyone rolled out, Kuber launched containers, Zabbix alarm that authorization does not work, go to Collector, parse by fields, we see where the problem is. We see from the logs that it started at this time, after the rollout of that. The problem was solved quickly and easily, and this is on the volume of more than 200 GB of logs per day, when more than 30 people work with the storage. And this is a real profit.
The benefits and harms of popular solutions for collecting logs have already been described in the article here. Colleagues analyzed systems such as Splunk, Graylog, and ELK. Revealed good and not so, for themselves, of course, sides in the solutions presented.
ELK turned out to be too cumbersome and resource-intensive. It is also very difficult to configure on large infrastructures.
Splunk “withdrew” its user trust by simply leaving the Russian market without giving any reason. Splunk’s partners and customers had to find new solutions and products.
The author of the mentioned article opted for Graylog and gives examples of installing and configuring this product.
A number of systems such as Humio, Loki and Monq have not been described. But since Humio is a SaaS service and paid, and Loki is a very simple log aggregator without parsing, enrichment and other useful features, we will consider only Monq. Monq is a suite of IT support products within a single platform that includes AIOps, automation, synthetic and umbrella monitoring and log analysis. Today we will look at Monq Collector – a completely free tool for collecting and analyzing logs.
Monq Collector architecture
Monq Collector is free software for collecting and analyzing logs for installation on a client’s infrastructure. It is delivered as a virtual machine image and can be downloaded here. Product documentation and interface are available in Russian and English.
One of the features of this tool for working with logs is the ability to process the incoming data stream on the preprocessor, using scripts and parsers created by yourself, in the built-in Lua IDE. This gives you very wide possibilities for filtering and transforming data. This functionality is richer than in the same Graylog.
Another distinguishing feature is the product architecture. The product is designed using microservices. And the storage of those very logs is carried out in the columnar analytical DBMS ClickHouse.
The key advantage of ClickHouse is the high speed of execution of SQL read queries (OLAP script), which is provided due to the following distinctive features:
- vector computing;
- parallelization of operations;
- columnar data storage;
- support for approximate calculations;
- physical sorting of data by primary key.
But one of the most important features of ClickHouse is a very efficient saving of storage space. The average compression ratio is 1:20, which is a very good result.
Native connector with Zabbix
If you paid attention to the title of the article, then initially we wanted to tell you what is good about using Monq in companies where Zabbix is used as an infrastructure monitoring system.
Firstly, the product for collecting and analyzing logs is provided absolutely free of charge and without any restrictions on traffic and time.
Secondly, the Monq Collector includes a built-in connector with Zabbix, which allows you to receive all events from Zabbix triggers and then view them on the same screen with the logs.
To receive events from Zabbix and other systems such as Nagios, Prometheus, SCOM, Ntopng, system handlers are provided, with the ability to customize the code or write your own handlers.
For example, you can convert the date format to a convenient format:
[crayon-6a5ef83c48112234539928/]Thirdly, if you install a trial or a paid add-on Monq AIOps, then a number of native Zabbix and Monq communication functions appear, which allow you to:
- bind Zabbix nodes and triggers to resource-service model in Monq
- automatically create correlation rules (synthetic triggers) Monq with preset filters and rules for events coming from Zabbix triggers
- work with low-level discovery (LLD) in Zabbix.
Synthetic triggers allow you to handle any event that goes into the Monq monitoring system. It is possible to create triggers from a template or customize it from scratch using scripts written in the Lua language in the IDE editor built into the web interface.
Using the Zabbix connector in Monq , you can drag and drop the entire infrastructure and build a resource-service model of the entire information system. This is convenient when you need to quickly find the localization of the problem, the cause of the incident.
The question is brewing, is it possible to differentiate access to logs to certain categories of persons? For example, so that information security logs are available to a certain category of persons? Yes.
To do this, Monq Collector has built a very flexible role model using workgroups. System users can simultaneously have different roles in different workgroups. By connecting the data stream, we can allow read or write access to certain roles and assign these roles to users.
How does this help me?
Let’s try to describe a small fictional use case.
We have a cluster running Kubernetes. There are several virtual machines for rent. All nodes are monitored using Zabbix. And there is an authorization service, which is very important for us, since several corporate services work through it.
Zabbix periodically reports that the authorization service is unavailable, then it is available again in a minute or two.
We want to find the reason for the drop in service and not flinch from every notification of the phone
Zabbix is an excellent monitoring tool, but it is not enough for incident investigation. Errors can often lie in the logs. And for this we will collect and analyze logs in the Monq Collector.
So step by step:
- Set up the collection of logs from the Nginx-ingress controller, which is located in a cluster running Kubernetes.
In this case, we will transfer logs to the collector using the fluent-bit utility. Here are the listings of configuration files:
[crayon-6a5ef83c4811c228063044/]Let’s prepare parsers for Nginx to convert raw to JSON:
[crayon-6a5ef83c48120099466664/]- We send logs to the collector using fluent-bit too (the Monq collector will have its own extractor in August, I will write about it later)
- Monitoring of infrastructure objects is carried out in Zabbix with a correlation of incoming flows in Monq.
- Some time passes and an event from Zabbix comes to Monq, stating that the authentication service is not available.
- Why? What happened? We open the Monq primary events screen, and there is already a flurry of events from the Nginx-ingress-controller
- Using the analytical tools of the primary screen, we find out that we have a 503 error. In 30 minutes, there are already 598 records of 31.31% of the total number of logs from the Nginx-ingress controller.
- From the same window, filter events, click on the error value and select “add to filter”. As a result, the source.code = 503 parameter will be added to the filter panel. Excessive log data will be removed from the screen.
- We turn to the analysis of structured logs and see at which URL the error is returned, understand which microservice is failing and quickly solve the problem by re-creating the container.
- For the future, we start logs from this container in Monq, and next time we know much more information about the problem that can be passed on to developers to edit the code.
Alerting and automation will soon appear in the free functionality of Monq Collector, which will allow such errors to be immediately triggered. So far, this functionality is only available in the paid Monq AIOps.
The case that I gave above is, of course, not from real life, but more a demonstration of general principles. In life, things are often not so obvious. From practice:
2019, we are developing a system in which 50+ containers. In each release, our release master spent a lot of time figuring out why the intermicroservice interaction could break. Moving between microservices and logs, each time typing kubectl get log, in one window, the same thing in the second window, then in the third. And you also need to tail the web server logs. Then I remembered that in the first window, etc. And then the team is growing, to give everyone access via ssh to the server? No, you need an aggregator.
We set up sending logs to ELK, collected everything that was needed, and then something happened. In ELK, each event source uses its own index and this is not very convenient. The team kept growing, outsourcers appeared, we realized that we needed to differentiate the rights of working groups. The number of logs began to grow strongly, the clustering of the database by its own means without the use of a tambourine began to be needed, a highload is needed. At ELK, all this is already for money. We decided to send the logs to the Monq Collector.
2021 year. The next release, everyone rolled out, Kuber launched containers, Zabbix alarm that authorization does not work, go to Collector, parse by fields, we see where the problem is. We see from the logs that it started at this time, after the rollout of that. The problem was solved quickly and easily, and this is on the volume of more than 200 GB of logs per day, when more than 30 people work with the storage. And this is a real profit.
If you use Zabbix to monitor your infrastructure objects, but have not yet gotten to collecting, storing and analyzing logs from these objects, then this article is for you.
Why collect logs and store them? Who needs it?
Logging allows you to give answers to questions, what? where? and under what circumstances happened in the IT environment several hours, days, months, even years ago. A constantly appearing error is difficult to localize, even knowing when and under what circumstances it manifests itself without having logs on hand. In the logs, information is written not only about the occurrence of certain errors, but also more detailed information that helps to understand the causes of the occurrence.
After you have launched your product and expect results from it, you need to constantly monitor the operation of the product, preventing failures before the consumer sees them.
And how to analyze the cause of a server crash, the logs of which are no longer available (covering up the traces of an intruder or any other force majeure circumstances), correctly, only centralized storage of logs will help.
If you are a software developer and for debugging you have to “walk” and look at the logs on the server, then convenient viewing, analysis, filtering and search in the web interface will simplify your actions, and you will be able to concentrate more on the task of debugging.
Analysis of logs – helps to identify conflicts in the configuration of services, to detect the source of occurrence of “events”, and also to determine information security events.
Together with monitoring services, logging significantly saves engineers time when investigating certain incidents.
Comparison of log analysis systems
The benefits and harms of popular solutions for collecting logs have already been described in the article here. Colleagues analyzed systems such as Splunk, Graylog, and ELK. Revealed good and not so, for themselves, of course, sides in the solutions presented.
ELK turned out to be too cumbersome and resource-intensive. It is also very difficult to configure on large infrastructures.
Splunk “withdrew” its user trust by simply leaving the Russian market without giving any reason. Splunk’s partners and customers had to find new solutions and products.
The author of the mentioned article opted for Graylog and gives examples of installing and configuring this product.
A number of systems such as Humio, Loki and Monq have not been described. But since Humio is a SaaS service and paid, and Loki is a very simple log aggregator without parsing, enrichment and other useful features, we will consider only Monq. Monq is a suite of IT support products within a single platform that includes AIOps, automation, synthetic and umbrella monitoring and log analysis. Today we will look at Monq Collector – a completely free tool for collecting and analyzing logs.
Monq Collector architecture
Monq Collector is free software for collecting and analyzing logs for installation on a client’s infrastructure. It is delivered as a virtual machine image and can be downloaded here. Product documentation and interface are available in Russian and English.
One of the features of this tool for working with logs is the ability to process the incoming data stream on the preprocessor, using scripts and parsers created by yourself, in the built-in Lua IDE. This gives you very wide possibilities for filtering and transforming data. This functionality is richer than in the same Graylog.
Another distinguishing feature is the product architecture. The product is designed using microservices. And the storage of those very logs is carried out in the columnar analytical DBMS ClickHouse.
The key advantage of ClickHouse is the high speed of execution of SQL read queries (OLAP script), which is provided due to the following distinctive features:
- vector computing;
- parallelization of operations;
- columnar data storage;
- support for approximate calculations;
- physical sorting of data by primary key.
But one of the most important features of ClickHouse is a very efficient saving of storage space. The average compression ratio is 1:20, which is a very good result.
Native connector with Zabbix
If you paid attention to the title of the article, then initially we wanted to tell you what is good about using Monq in companies where Zabbix is used as an infrastructure monitoring system.
Firstly, the product for collecting and analyzing logs is provided absolutely free of charge and without any restrictions on traffic and time.
Secondly, the Monq Collector includes a built-in connector with Zabbix, which allows you to receive all events from Zabbix triggers and then view them on the same screen with the logs.
To receive events from Zabbix and other systems such as Nagios, Prometheus, SCOM, Ntopng, system handlers are provided, with the ability to customize the code or write your own handlers.
For example, you can convert the date format to a convenient format:
[crayon-6a5ef83c48112234539928/]Thirdly, if you install a trial or a paid add-on Monq AIOps, then a number of native Zabbix and Monq communication functions appear, which allow you to:
- bind Zabbix nodes and triggers to resource-service model in Monq
- automatically create correlation rules (synthetic triggers) Monq with preset filters and rules for events coming from Zabbix triggers
- work with low-level discovery (LLD) in Zabbix.
Synthetic triggers allow you to handle any event that goes into the Monq monitoring system. It is possible to create triggers from a template or customize it from scratch using scripts written in the Lua language in the IDE editor built into the web interface.
Using the Zabbix connector in Monq , you can drag and drop the entire infrastructure and build a resource-service model of the entire information system. This is convenient when you need to quickly find the localization of the problem, the cause of the incident.
The question is brewing, is it possible to differentiate access to logs to certain categories of persons? For example, so that information security logs are available to a certain category of persons? Yes.
To do this, Monq Collector has built a very flexible role model using workgroups. System users can simultaneously have different roles in different workgroups. By connecting the data stream, we can allow read or write access to certain roles and assign these roles to users.
How does this help me?
Let’s try to describe a small fictional use case.
We have a cluster running Kubernetes. There are several virtual machines for rent. All nodes are monitored using Zabbix. And there is an authorization service, which is very important for us, since several corporate services work through it.
Zabbix periodically reports that the authorization service is unavailable, then it is available again in a minute or two.
We want to find the reason for the drop in service and not flinch from every notification of the phone
Zabbix is an excellent monitoring tool, but it is not enough for incident investigation. Errors can often lie in the logs. And for this we will collect and analyze logs in the Monq Collector.
So step by step:
- Set up the collection of logs from the Nginx-ingress controller, which is located in a cluster running Kubernetes.
In this case, we will transfer logs to the collector using the fluent-bit utility. Here are the listings of configuration files:
[crayon-6a5ef83c4811c228063044/]Let’s prepare parsers for Nginx to convert raw to JSON:
[crayon-6a5ef83c48120099466664/]- We send logs to the collector using fluent-bit too (the Monq collector will have its own extractor in August, I will write about it later)
- Monitoring of infrastructure objects is carried out in Zabbix with a correlation of incoming flows in Monq.
- Some time passes and an event from Zabbix comes to Monq, stating that the authentication service is not available.
- Why? What happened? We open the Monq primary events screen, and there is already a flurry of events from the Nginx-ingress-controller
- Using the analytical tools of the primary screen, we find out that we have a 503 error. In 30 minutes, there are already 598 records of 31.31% of the total number of logs from the Nginx-ingress controller.
- From the same window, filter events, click on the error value and select “add to filter”. As a result, the source.code = 503 parameter will be added to the filter panel. Excessive log data will be removed from the screen.
- We turn to the analysis of structured logs and see at which URL the error is returned, understand which microservice is failing and quickly solve the problem by re-creating the container.
- For the future, we start logs from this container in Monq, and next time we know much more information about the problem that can be passed on to developers to edit the code.
Alerting and automation will soon appear in the free functionality of Monq Collector, which will allow such errors to be immediately triggered. So far, this functionality is only available in the paid Monq AIOps.
The case that I gave above is, of course, not from real life, but more a demonstration of general principles. In life, things are often not so obvious. From practice:
2019, we are developing a system in which 50+ containers. In each release, our release master spent a lot of time figuring out why the intermicroservice interaction could break. Moving between microservices and logs, each time typing kubectl get log, in one window, the same thing in the second window, then in the third. And you also need to tail the web server logs. Then I remembered that in the first window, etc. And then the team is growing, to give everyone access via ssh to the server? No, you need an aggregator.
We set up sending logs to ELK, collected everything that was needed, and then something happened. In ELK, each event source uses its own index and this is not very convenient. The team kept growing, outsourcers appeared, we realized that we needed to differentiate the rights of working groups. The number of logs began to grow strongly, the clustering of the database by its own means without the use of a tambourine began to be needed, a highload is needed. At ELK, all this is already for money. We decided to send the logs to the Monq Collector.
2021 year. The next release, everyone rolled out, Kuber launched containers, Zabbix alarm that authorization does not work, go to Collector, parse by fields, we see where the problem is. We see from the logs that it started at this time, after the rollout of that. The problem was solved quickly and easily, and this is on the volume of more than 200 GB of logs per day, when more than 30 people work with the storage. And this is a real profit.
