Challenges with Graylog
The company grew, new data centers appeared, the load increased noticeably, even with a solution of communication logs. We thought that Graylog is no longer perfect.
Unified scheme and centralization. I would like to have a single cluster management tool in 10 data centers. Also, the question arose of a unified data mapping scheme so that there were no collisions.
API. We use our own interface to display the connections between the logs and the standard Graylog API was not always convenient to use, for example, when you need to display data from different data centers, correctly sort and mark them. Therefore, we wanted to be able to change the API as we like.
Performance, it is difficult to assess the loss. Our traffic is 3 TB of logs per day, which is decent. Therefore, Graylog did not always work stably, it was necessary to get into its insides in order to understand the causes of failures. It turned out that we were no longer using it as a tool – we had to do something about it.
Processing delays (queues). We did not like the standard implementation of the queue in Graylog.
The need to support MongoDB. Graylog drags MongoDB, it was necessary to administer this system as well.
We realized that at this stage we want our own solution. Perhaps there are fewer cool features for alerts that have not been used, for dashboards, but own is better.
Our decision
We have developed our own Logs service.
At that moment, we already had expertise in servicing and maintaining large Elasticsearch clusters, so we took Elasticsearch as a basis. The standard stack in the company is JVM, but for the backend we also use Kotlin famously, so we took this language for the service.
The first question is how to rotate data and what to do with mapping. We use fixed mapping. In Elasticsearch, it is better to have indexes of the same size. But with such indexes, we need to somehow map data, especially for several data centers, a distributed system and a distributed state. There were ideas to fasten ZooKeeper, but this is again a complication of maintenance and code.
One index for one hour, in other data centers 2 indexes for an hour, in the third one index for 3 hours, but all in time. Indexes are obtained in different sizes, because at night the traffic is less than during the day, but in general it works. Experience has shown that no complications are needed.
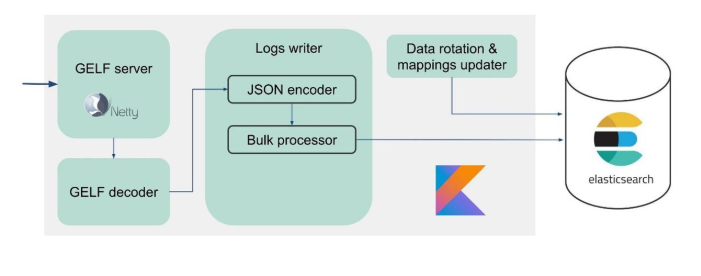
For ease of migration and given the large amount of data, we chose the GELF protocol – a simple Graylog protocol based on TCP. So we got a GELF server for Netty and a GELF decoder.
Then JSON is encoded for writing to Elasticsearch. We use the official Java API from Elasticsearch and write Bulk’s.
This is an important optimization. The API provides a Bulk processor that automatically accumulates requests and then sends them for recording in a bundle or over time.
Problem with Bulk Processor
Everything seems to be fine. But we started and realized that we skipped the Bulk processor – it was unexpected. We cannot achieve the values we were counting on – the problem came from nowhere.
In the standard implementation, the Bulk processor is single-threaded, synchronous, despite the fact that there is a parallelism setting. That was the problem.
We checked and it turned out that this is a known, but not resolved bug. We changed the Bulk processor a bit – made an explicit lock through ReentrantLock. Only in May, similar changes were made to the official Elasticsearch repository and will be available only from version 7.3. The current one is 7.1, and we are using version 6.3.
If you also work with a Bulk-processor and want to speed up the entry in Elasticsearch – look at these changes on GitHub and port back to your version. Changes affect only the Bulk processor. There will be no difficulties if you need to port to the version below.
Everything is fine, the Bulk processor has gone, the speed has accelerated.
Elasticsearch write performance is unstable over time, as various operations take place there: index merging, flush. Also, performance slows down for a while during maintenance, when part of the nodes are dropped out of the cluster, for example.
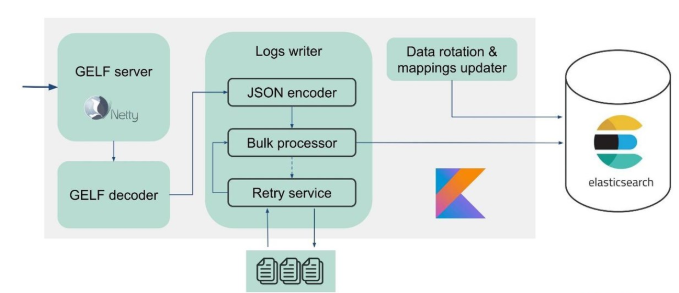
In this regard, we realized that we need to implement not only the buffer in memory, but also the queue. We decided that we would only send rejected messages to the queue – only those that the Bulk processor could not write to Elasticsearch.
Retry fallback
This is a simple implementation.
- We save rejected messages to the file – RejectedExecutionHandler.
- Resend at the specified interval in a separate executor.
- However, we do not delay new traffic.
For support engineers and developers, the new traffic in the system is noticeably more important than the one that for some reason was delayed during the spike or slowdown of Elasticsearch. Its lingered, but it would come later – no big deal. New traffic is prioritized.
Now let’s talk about how we prepare Elasticsearch, what parameters we used and how we set them up.
Elasticsearch Configuration
The problem we are faced with is the need to speed up Elasticsearch and optimize it for writing, since the number of readings is noticeably less.
We used several parameters.
“ignore_malformed”: true – discard fields with the wrong type, and not the entire document. We still want to store the data, even if for some reason fields with incorrect mapping have leaked there. This option is not entirely related to performance.
For hardware, Elasticsearch has a nuance. When we started asking for large clusters, we were told that RAID-arrays from SSD-drives for your volumes is terribly expensive. But arrays are not needed because fault tolerance and partitioning is already built into Elasticsearch. Even on the official website there is a recommendation to take more cheap hardware than less expensive and good. This applies to both disks and the number of processor cores, because the whole Elasticsearch parallels very well.
“index.merge.scheduler.max_thread_count”: 1 – recommended for HDD.
If you didn’t get SSDs, but ordinary HDDs, then set this parameter to one. Indexes are written in pieces, then these pieces are frozen. This saves a little bit of disk, but, above all, speeds up the search. Also, when you stop writing to the index, you can do force merge. When the load on the cluster is less, it automatically freezes.
“index.unassigned.node_left.delayed_timeout”: “5m” – delay of deployment when a node disappears. This is the time after which Elasticsearch will begin to implement indexes and data if a node is rebooted, deployed, or withdrawn for maintenance. But if you have a heavy load on the disk and network, then deployment is a difficult operation. In order not to overload them, this timeout is better to control and understand what delays are needed.
“index.refresh_interval”: -1 – do not update indexes if there are no search queries. Then the index will be updated when a search query appears. This index can be set in seconds and minutes.
“index.translogDurability”: “async” – how often to execute fsync: with each request or by time. Gives performance boost for slow drives.
We also have an interesting way to use it. Support and developers want to be able to search and use full-text Regexp’s throughout the message body. But in Elasticsearch this is not possible – it can only search by tokens that already exist in its system. RegExp and wildcard can be used, but the token cannot start with some RegExp. Therefore, we added word_delimiter to the filter:
"tokenizer": "standard" "filter" : [ "word_delimiter" ]
It automatically splits words into tokens:
- “Wi-Fi” → “Wi”, “Fi
- “PowerShot” → “Power”, “Shot
- “SD500” → “SD”, “500
About the cluster
The number of shards should be equal to the number of data nodes for load balancing. The minimum number of replicas is 1, then each node will have one main shard and one replica. But if you have valuable data, for example, financial transactions, better than 2 or more.
The size of the shard is from a few GB to several tens of GB. The number of shards on a node is no more than 20 per 1 GB of Elasticsearch hip, of course. Further Elasticsearch slows down – we also attacked it. In those data centers where there is little traffic, the data did not rotate in volume, thousands of indexes appeared and the system crashed.
Use allocation awareness, for example, by the name of a hypervisor in case of maintenance. Helps scatter indexes and shards across different hypervisors so that they do not overlap when a hypervisor drops out.
Create indexes in advance. Good practice, especially when writing on time. The index is immediately hot, ready and there are no delays.
Limit the number of shards of one index per node. “index.routing.allocation.total_shards_per_node”: 4 is the maximum number of shards of one index per node. In the ideal case, there are 2 of them, we put 4 just in case, if we still have fewer machines.
What is the problem here? We use allocation awareness – Elasticsearch knows how to properly spread indexes across hypervisors. But we found out that after the node was turned off for a long time, and then comes back to the cluster, Elasticsearch sees that it has formally fewer indexes and they are restored. Until the data is synchronized, formally there are few indexes on the node. If necessary, allocate a new index, Elasticsearch tries to hammer this machine as densely as possible with fresh indexes. So a node receives a load not only from the fact that data is replicated to it, but also with fresh traffic, indexes and new data that fall on this node. Control and limit it.The name of the class, various debugging information is written in a similar way. With it, we closed some of the problems with full-text search. I advise you to add such settings when working with the login.
Elasticsearch Maintenance Recommendations
Those who work with Elasticsearch are familiar with these recommendations.
Disable shard allocation. Disable the allocation of replicas shard, leave the ability to allocate only primary. This noticeably helps Elasticsearch – it will not reallocate data that you do not need. For example, you know that in half an hour a node will rise – why transfer all shards from one node to another? Nothing terrible will happen if you live with the yellow cluster for half an hour, when only primary shards are available.
Synced flush. In this case, the node synchronizes much faster when it returns to the cluster.
If you download a large amount of data, for example, peak load, you can turn off shards and later give a command to Elasticsearch to create them when the load is already less.
Here are a few commands that I like to use:
GET _cat / thread_pool? V – allows you to see thread_pool on each node: what’s hot now, what are the write and read queues.
GET _cat / recovery /? Active_only = true – which indexes are being deployed to, where the recovery is taking place.
GET _cluster / allocation / explain – in a convenient human form why and which indexes or replicas were not allocated.
For monitoring we use Grafana.
There is an excellent exporter and Grafana teamplay from Vincent van Hollebeke, which allows you to visually see the status of the cluster and all its main parameters. We added it to our Docker image and all the metrics when deploying from our box.
Logging Conclusions
Logs should be:
- centralized – a single entry point for developers
- available – the ability to quickly search
- structured – for quick and convenient extraction of valuable information
- correlated – not only among themselves, but also with other metrics and systems that you use.
The Swedish Melodifestivalen contest has recently been held. This is a selection of representatives from Sweden for Eurovision. Before the competition, our support service contacted us: “Now in Sweden there will be a big load. The traffic is quite sensitive and we want to correlate some data. You have data in the logs that is missing on the Grafana dashboard. We have metrics that can be taken from Prometheus, but we need data on specific ID requests”.
They added Elasticsearch as the source of Grafana and were able to correlate this data, close the problem and get a pretty good result fast enough.
Now, instead of the 10 Graylog clusters that worked for this solution, we have several services. These are 10 data centers, but we don’t even have a dedicated team and people who serve them. There are several people who have worked on them and change something as needed. This small team is perfectly integrated into our infrastructure – deploying and servicing is easier and cheaper.
These are separate tools for logging, tracing and monitoring. There is no “golden instrument” that will cover all your needs.
To understand which tool is needed, what to monitor, where to use the logs, what requirements to the logs, you should definitely refer to SLI / SLO – Service Level Indicator / Service Level Objective. You need to know what is important for your customers and your business, what indicators they look at.

