GUIs for Kubernetes Overview
Serving many Kubernetes clusters of various sizes, we are also interested in the ability to provide customers with a visual work tool. When choosing the right interface, the key features for us were the following:
- support for Differentiation of User Rights (RBAC);
- visualization of the state of the namespace and standard Kubernetes primitives (Deployment, StatefulSet, Service, Cronjob, Job, Ingress, ConfigMap, Secret, PVC);
- gaining access to the command line inside pod;
- viewing pod’s logs;
- viewing pod’s status (describe status);
- removal of pods.
Other functions, such as viewing consumed resources (by pods/controllers / namespaces), creating/editing K8s primitives, are not relevant in our workflow.
We will start our review with the classic Kubernetes Dashboard, which is accepted as our standard. Since the world is always changing (which means that Kubernetes has new GUIs), we will also discuss its current alternatives.
Kubernetes Dashboard
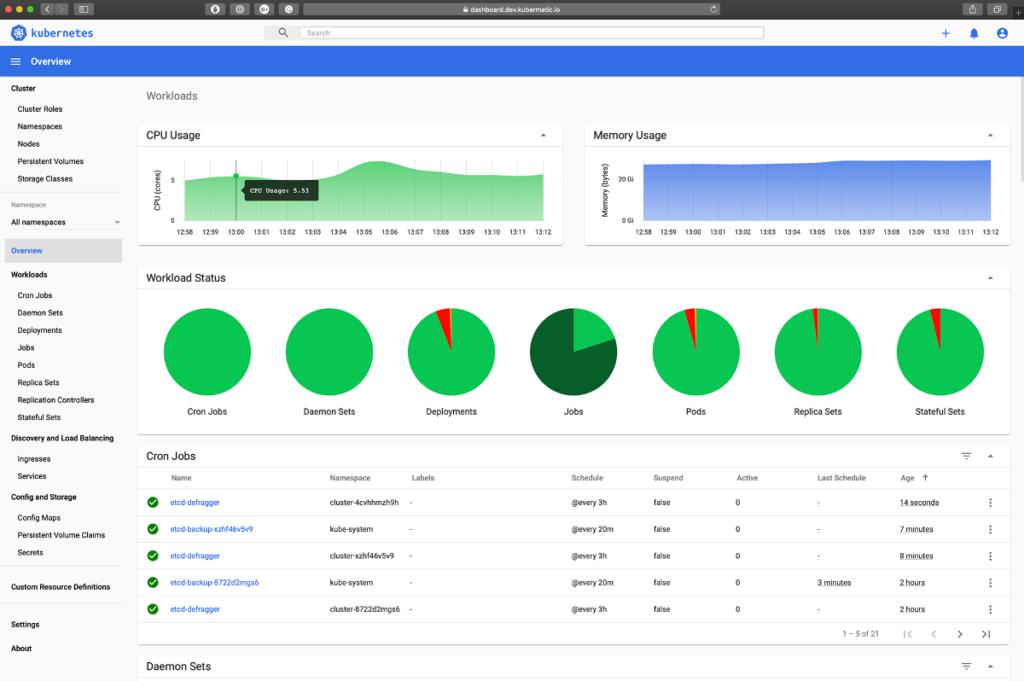
This is a general-purpose dashboard reviewed by Kubernetes in the official documentation (although not deployed by default). It is designed for the needs of the everyday operations and debugging applications in a cluster. We use it at home as a full-fledged lightweight visual tool that allows developers to provide the necessary and sufficient access to the cluster. Its capabilities cover all their needs that arise during the use of the cluster. As you might guess, this means that it satisfies all of the requirements listed above.
Among the main features of Kubernetes Dashboard:
- Navigation: View K8s core objects by namespace.
- If you have administrator rights, the panel displays the nodes, namespaces, and Persistent Volumes. The nodes are available statistics on the use of memory, processor, resource allocation, metrics, status, events, etc.
- View applications deployed in the namespace by their type (Deployment, StatefulSet, etc.), the relationships between them (ReplicaSet, Horizontal Pod Autoscaler), general and personalized statistics and information.
- View services and Ingress’s, as well as their relationship with pods and endpoints.
- View file objects and storage: Persistent Volume and Persistent Volume Claim.
- View and edit ConfigMap and Secret.
- View logs.
- Command-line access in containers.
A significant drawback (however, not for us) is that there is no support for multicluster work. The project is actively developed by the community and supports relevant functions with the release of new versions and specifications of the Kubernetes API: the latest panel version – v2.0.1 from May 22, 2020 – was tested for compatibility with Kubernetes 1.18.
Lens
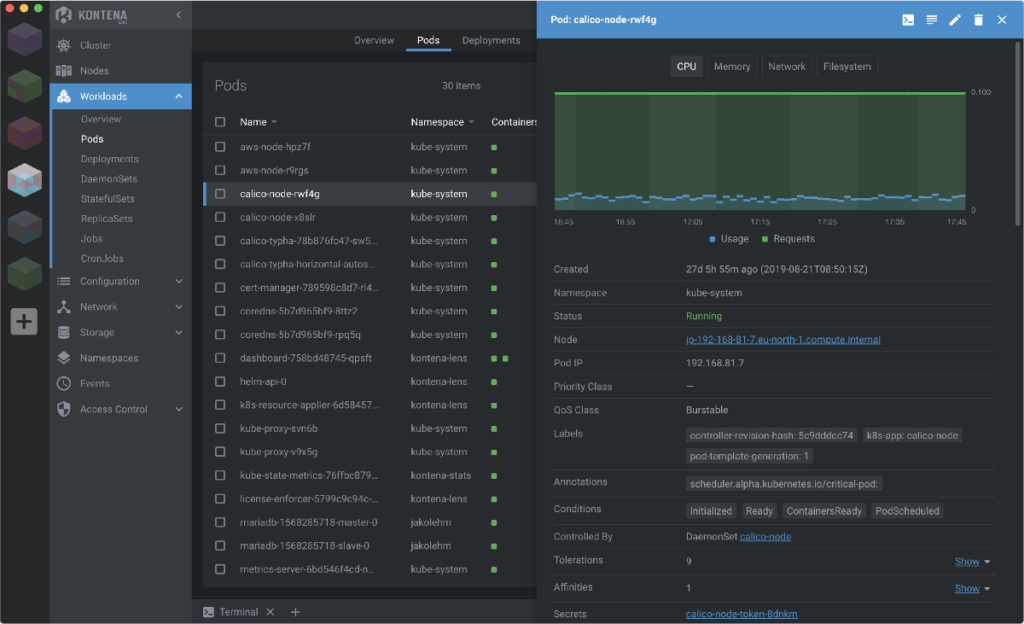
The project is positioned as a complete integrated development environment (IDE) for Kubernetes. Moreover, it is optimized to work with many clusters and a large number of pods running in them (tested on 25 thousand pods).
Key Features of Lens:
- A stand-alone application that does not require installing anything inside the cluster (more precisely, Prometheus will be required to get all the metrics, but you can use an existing installation for this). The “main” installation is done on a personal computer running Linux, macOS or Windows.
- Multicluster management (hundreds of clusters are supported).
- Visualization of the cluster state in real-time.
- Resource usage graphs and trends with history based on the built-in Prometheus.
- Access to the command line of containers and on cluster nodes.
- Full Kubernetes RBAC support.
The current release is 3.5.0 dated June 16, 2020. The original version was created by Kontena, and today all intellectual property has been transferred to a special organization Lakend Labs, called the “cloud geek and technology association,” which is responsible for “preserving and the availability of Kontena’s Open Source software and products. ”
Lens is the second most popular project on GitHub from the GUI category for Kubernetes, which only loses the Kubernets Dashboard itself. All other Open Source solutions not from the CLI * category are significantly inferior in popularity.
Kubernetic
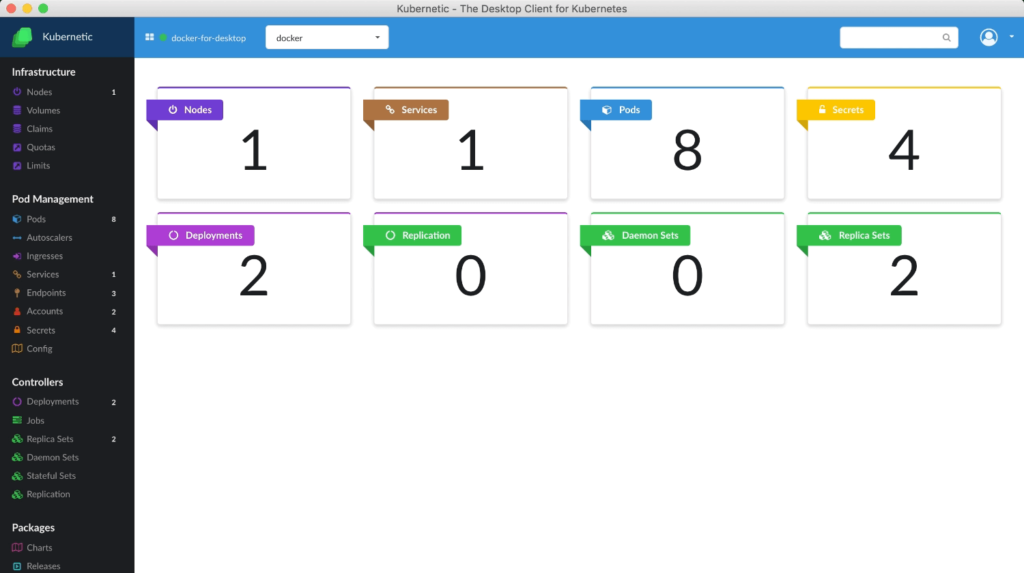
This is a proprietary application that is installed on a personal computer (Linux, macOS, Windows are supported). Its authors promise a complete replacement of the command line utility, and with it, the absence of the need to remember commands and even a tenfold increase in the speed of work.
One of the interesting features of the tool is the built-in support for Helm charts, and one of the drawbacks is the lack of application performance metrics.
Key features of Kubernetic:
- Convenient display of cluster status. One screen for viewing all related cluster objects and their dependencies; red/green readiness status for all objects; Cluster status viewing mode with real-time status update.
- Quick action buttons for uninstalling and scaling an application.
- Support for multi-cluster work.
- Simple work with namespaces.
- Support for Helm charts and Helm repositories (including private ones). Setting and managing charts in the web interface.
The actual value of the product is a one-time payment of 30 euros for its use by one person for any number of namespaces and clusters.
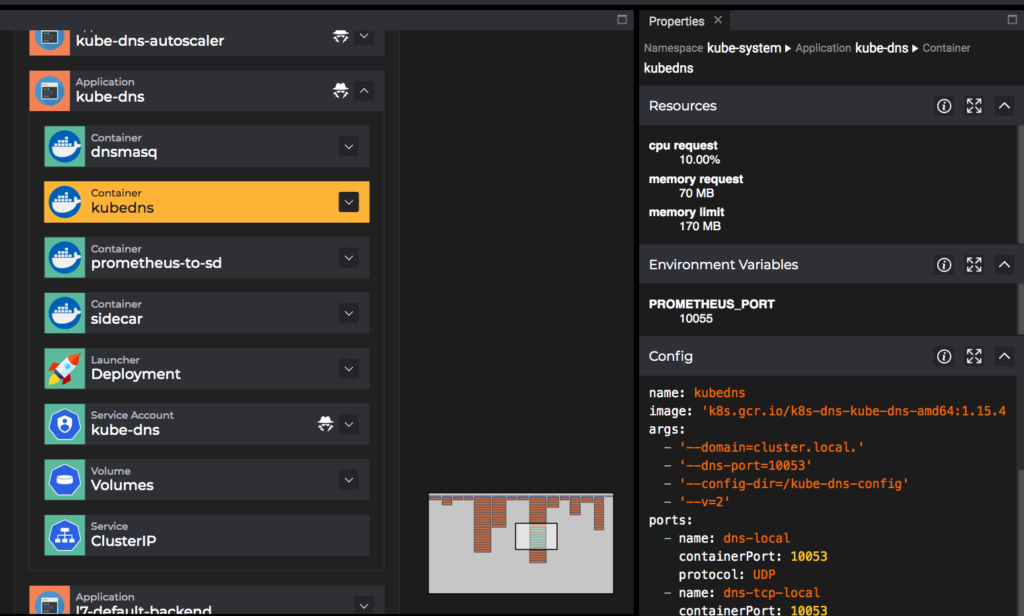
Kubevious
The project idea is to create a tool designed to analyze and debug application configurations deployed in a cluster. The authors focused primarily on the implementation of these features, leaving more general things for later.
Key features and functions of Kubevious:
- Cluster visualization in an application-oriented mode: interconnected objects in an interface are grouped together in a hierarchy.
- Visual display of dependencies in configurations and cascading consequences of their changes.
- Display cluster configuration errors: misuse of labels, missed ports, etc.
- In addition to the previous paragraph, the detection of potentially dangerous containers, i.e. having too large privileges (attributes hostPID, hostNetwork, hostIPC, mounting docker.sock and the like).
- An advanced cluster search system (not only by the names of objects, but also by their properties).
- Tools for capacity planning and resource optimization.
- Built-in “time machine” (the ability to see changes to the configuration of objects that occurred earlier).
- Manage RBAC using a pivot related table from Roles, RoleBindings, ServiceAccounts.
- It works with only one cluster.
The project has a very short history (the first release took place on February 11, 2020) and it seems that there has been a period of stabilization or a slowdown in development. If previous versions were released often, then the latest release (v0.5 dated April 15, 2020) lagged behind the initial pace of development. This is probably due to the small number of contributors: there are only 4 in the history of the repository, and all the actual work is carried out by one person.
Kubewise
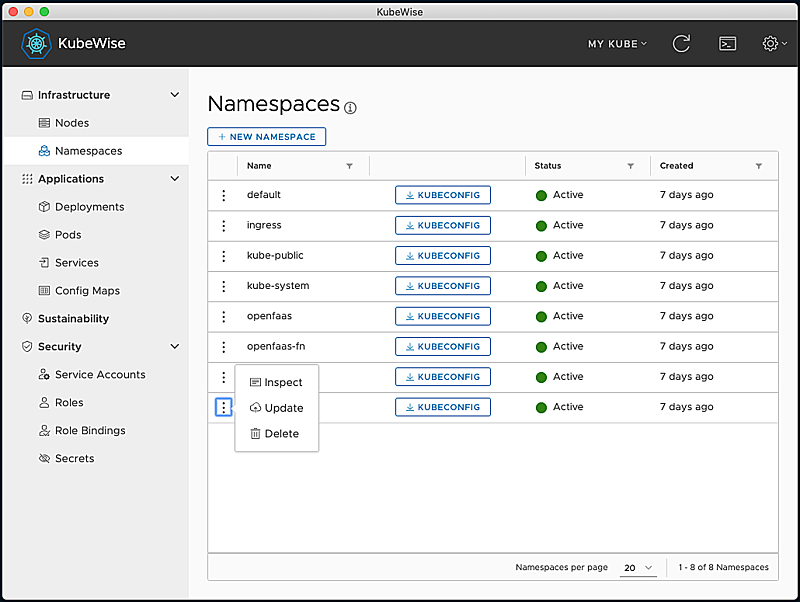
A new product from VMware, originally created as part of the internal hackathon (in June 2019). It is installed on a personal computer, runs on the basis of Electron (Linux, macOS and Windows are supported) and requires kubectl no lower than v1.14.0.
Key features of Kubewise:
- Interface interaction with the most commonly used Kubernetes entities: nodes, namespaces, etc.
- Support for multiple kubeconfig files for different clusters.
- A terminal with the ability to set the environment variable KUBECONFIG.
- Generation of custom kubeconfig files for a given namespace.
- Advanced security features (RBAC, passwords, service accounts).
So far, the project has only one release – version 1.1.0 of November 26, 2019. Moreover, the authors planned to release it immediately as Open Source, however, due to internal problems (not related to technical issues), they could not do this. As of May 2020, the authors are working on the next release and at the same time should initiate the process of opening the code.
OpenShift Console
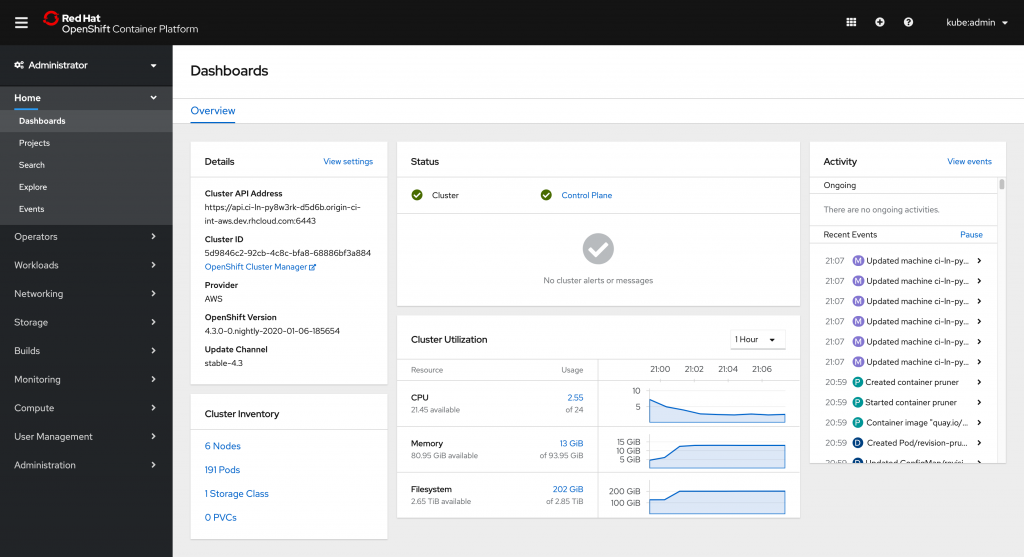
Despite the fact that this web interface is part of the OpenShift distribution (there it is installed using a special operator), the authors provided for the possibility of installing / using it in normal (vanilla) Kubernetes installations.
The OpenShift Console has been developing for a long time, so it has incorporated many functions. We mention the main ones:
- A shared approach to the interface is the two “perspectives” of the features available in Console: for administrators and for developers. Developer perspective mode groups objects in a more understandable way for developers (by application) and directs the interface to solving common tasks such as application deployment, tracking build/deployment status, and even editing code through Eclipse Che.
- Manage workloads, network, storage, access rights.
- Logical separation for workloads on projects and applications. In one of the latest releases – v4.3 – a special Project dashboard appeared, displaying the usual data (the number and status of deployments, pods, etc .; resource consumption and other metrics) in the project slice.
- Updated in real-time display of the cluster state, changes (events) occurred in it; view logs.
- View monitoring data based on Prometheus, Alertmanager and Grafana.
- Management of operators represented in OperatorHub.
- Manage assemblies that run through Docker (from a specified repository with a Dockerfile), S2I, or arbitrary external utilities.
