
How to make a technical audit of a frontend application
A site audit is well-known as a comprehensive analysis of the factors that affect its visibility in search engines, that is, an SEO audit. Also beginning to gain popularity are UX audits, which measure the effectiveness, usability and logic of user interfaces.
To check the speed of the site and identify the causes of delays, there is a technical audit. It is recommended to conduct it even if the system seems to be working properly and there are no performance issues. The fact is that it can still be improved: infrastructure optimization will speed up the delivery of code, and refactoring the codebase will help reduce maintenance costs.
In this article, we will show how a technical audit of a site goes by the example of a popular news resource, which is visited by tens of thousands of users per hour. Let’s consider the independent stages of verification and analysis, as a result of which we will clearly show how you can improve the project and eliminate bottlenecks that slow down page loading.
Collection of metrics and analysis of static site resources
Be sure to collect metrics and measure everything you can using ready-made tools like Google Page Speed, Lighthouse and Web.dev. This is the fastest way to get metrics that will serve as a starting point for your research. With their help, you will understand what is worth paying attention to in the first place, what can be optimized.
We advise you to run the analysis with the ad blocker turned on and off. As a result, you will find out how quickly the first rendering of content takes place, and how many third-party scripts are connected on the site.
At this stage, you will also see how many basic operations occur when rendering the site:
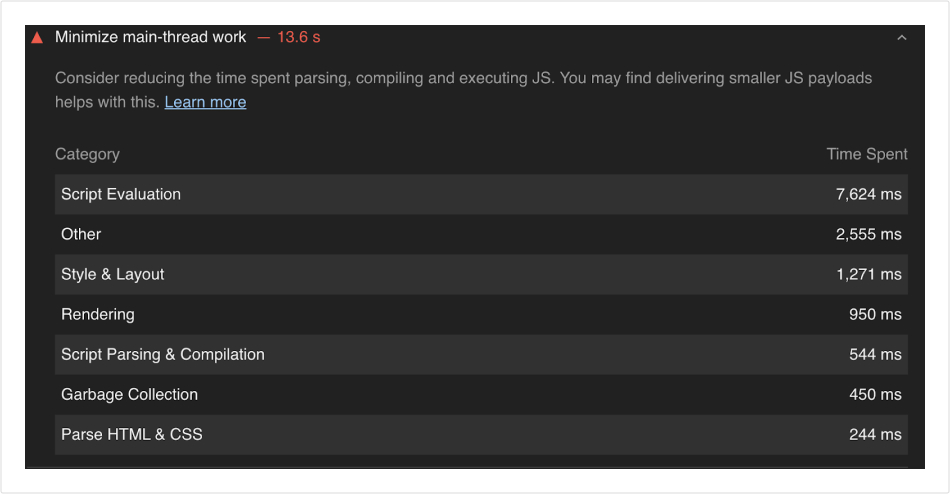
The metrics collected are likely to indicate space for improving static site assets: images, videos, scripts, styles, and fonts. Analyze this data and make sure you follow the general static resource practices. However, remember that these are only guidelines, not strict requirements.
In our example, all images are stored in jpg format. If you use webp, which browsers support perfectly, the file size will be reduced by an average of 20%. You can set up automatic webp compression for high-resolution images only. High-resolution videos are recommended to be converted to webm for browsers that support this format. To reduce the load on the network, it is advisable to disable autoplay of videos that are not visible. This can be done using the Intersection Observer API.
Make sure your site has progressive downloads and add compression everywhere if possible. Make sure to use modern script compression techniques like brotli, gzip and deflate.
Don’t load what is not used. This can apply to code, styles, symbols, images. If, for example, the site has a button that appears in one of a thousand cases, then the script that processes it should be connected only on demand.
In the example above, you can see that ~ 93% of the total code is not used (~ 340 kb.) A bundle with a code is considered ideal if its coverage is 100% when covering all cases without reloading the page. This can happen if the code is not used at all or if the code splitting is misconfigured, or it is used but on other pages, or when a certain scenario is reached.
The solution to this problem is to move the reusable components into separate files (chunks), which are then connected only in places where they are needed.
As we said, these requirements are optional, but the optimization of static resources is important, since the user notices them first.
Let’s take fonts as an example – on this project they took too long to load. Since we do not want the user to see standard fonts, we load them at the very beginning, in the critical-css section. How to solve this problem? You can optimize fonts at the code level, change the connection order, replace ttf with woff2.
You can also try to reduce the number of fonts used, which entails the redesign, but this is not always justified. If the site uses the Google Fonts library, then remove unused characters from the files, this is not prohibited by copyright.
But sometimes it’s easier to leave things as they are and focus on other possibilities.
Examining HTTP requests
At this stage, we check if the frontend interacts with the backend correctly:
- there is configured compression for API requests;
- there are no parasitic queries that load the connection, the results of which are not used anywhere;
- there are no requests that are returned with an error without the user completing a specific business case;
- when the page is initially loaded, the browser does not send requests to the API (if the site uses server-side rendering, as in our example);
- there are no duplicate requests. If a request is made when going to any page, it is better to send it once and save the data for reuse;
- long-pending requests are absent, or their number is insignificant. If such requests are found, then find out what they are responsible for, what they give to the user. Some requests cannot be executed faster, so it is recommended to make them independent – draw a spinner so as not to make the browser wait for a response.
Also, when analyzing requests, you may find bugs. This is how we encountered the wrong operation of the frontend application, which could send more than 100 requests per second, which greatly loaded the server. The screen blinked, the loader spun endlessly, etc. The reason was hidden in an incorrectly implemented scroll. The browser kept its position at the bottom of the page when new elements appeared. That is, when scrolling through the page, a loader was launched, due to which the page moved down. The Javascript handler re-sent the request, which in turn triggered the loader animation again, due to which the page size changed, and so on ad infinitum.

Analysis of external scripts and resources
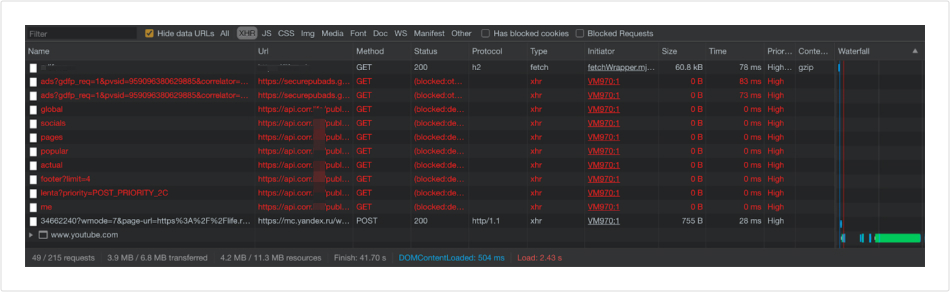
At this stage, you should determine which resources from third-party sites take the longest to load.
The modern web allows you to prioritize any downloads. Often, metrics and ads are loaded before the page is displayed, which in itself makes no sense, since the user will still not be able to see the ad, but the site will take longer to load. We recommend displaying ads immediately after rendering the site, which will not affect the statistics in any way – otherwise the user will see a white screen for some time.
Pages profiling
Use the chrome dev tools to profile your site pages to track long requests and increased CPU usage. As a result, you will see what is clearly loading the site.
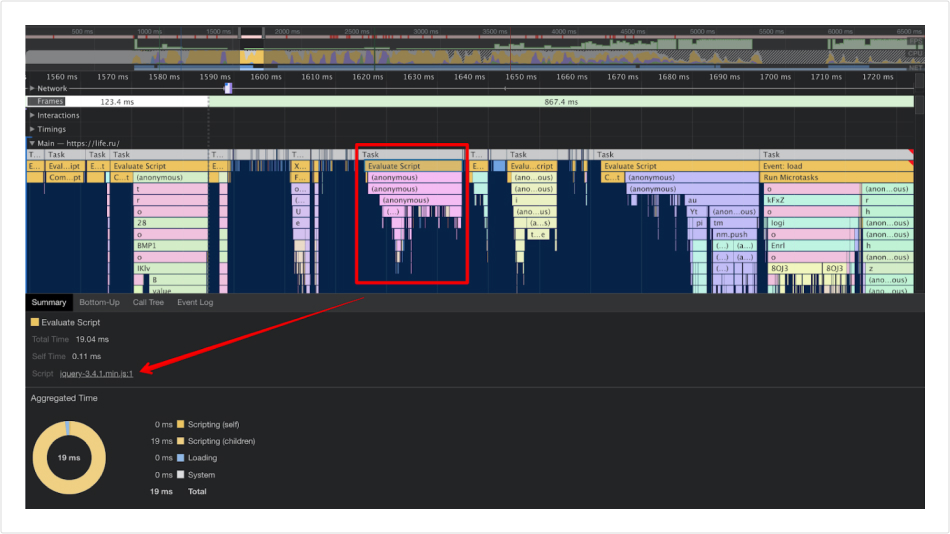
The screenshot shows that it takes 19 milliseconds to load Jquery, which is not needed at the moment. Better to load jquery after main resources, preferably after a successful load event (e.g. onload, domcontentloaded.)
Analysis of the quantity and duration of requests
At this stage, we will explore how the frontend interacts with the backend. To do this, you need to analyze the number and duration of all requests. To get a more complete picture, you need to measure the average response time for one request and for parallel ones.
For clarity, combine the obtained data into a summary chart. This way, you can quickly identify which queries are taking much longer than others.
If the site is installed on a powerful server, then the execution time for 100 parallel requests should not greatly exceed the execution time for one request.
In this project, for some requests, gateway timeout occurred, that is, the response from the server did not come at all.
Overhead in high-load projects is normal. However, if possible, you should try to break down requests into their component parts in cases where one request is responsible for several actions. Execute these parts in parallel threads.
What can be done to improve the server? Connect the library for monitoring the server and restarting the application (in the case of node.js, this is pm2). It is also recommended to connect an error monitoring tool such as Sentry. Configure error output and crash logging. This way you can track downtime for your application.
Ideally, set up an asynchronous logger to monitor any activity on the site (API requests, requests to the database, external APIs, to the file system or services for working with the file system), which will log them into a separate database.
Static analysis of source code
This analysis is performed by utilities that will point out the wrong code and help get rid of the “dead code”. It is worth noting that these tools should be used automatically during development, but you don’t always have to rely on the integrity of the developers, so it’s best not to skip this check.
To do static analysis, you need to use eslint linters and other code formatting utilities like prettier and sonar that track code violations.
Usually, such violations do not affect the performance of the site, but they complicate the reading and writing of the code, which means that it will be more expensive to maintain. For example, on this project, we found a function in which there were three arguments, one of which was not used – such little things in the aggregate increase the technical debt of the project.
Semantic analysis of source code
At this point, the programmer will need to manually examine the project files. It is worth noting that only obvious errors in the behavior of the source code will be evaluated; for a deeper analysis, you need to know the logic of the project well. At this stage, you can find repetitive code that can be moved to one place (class, function or constant) to reduce the number of lines and reduce the possibility of bugs.
Sometimes this analysis will help determine if the development team is having problems. From lines of code from Git, you can determine who the author is and determine the performance of individual employees. You may find that more than half of the comments refer to one developer.
For example, here we have identified ten asynchronous operations that update the database, but they were performed one by one, without being connected to each other. This means that their performance can be doubled by running them in parallel. Use parallelism whenever possible, because even in current PHP versions, artificial parallelism can be set up to improve system performance.
Summary
Software development involves a lot of risks, and in reality, you often have to make compromises to get a project up and running on time. Therefore, the documentation is usually drawn up retroactively, and the optimization of the site is postponed until the very last moment.
But it’s never too late to tackle performance improvements. Speeding up your website will improve the user experience and give a positive audience response. With the help of a technical audit, you can determine what causes delays in the work of the site – front-end or back-end application.


