Technical Overview: .NET Code Optimization in Application Insights
Code Optimization in Application Insights is a powerful tool built to help developers improve the performance of their .NET applications. It analyzes application behavior, identifies bottlenecks, and provides actionable, code-level recommendations to resolve performance issues.
How It Works
The tool works by integrating with the .NET profiler in Application Insights, automatically processing tracing data collected during the app’s runtime.
Key capabilities include:
-
Continuous Analysis: It constantly monitors profiler traces to detect inefficiencies in the code.
-
Bottleneck Detection: Identifies areas where CPU usage or memory consumption is unusually high.
-
Actionable Recommendations: Provides concrete, code-level suggestions that developers can access directly from the Azure portal.
Visuals of Code Optimization in the Performance blade highlight actionable insights for developers.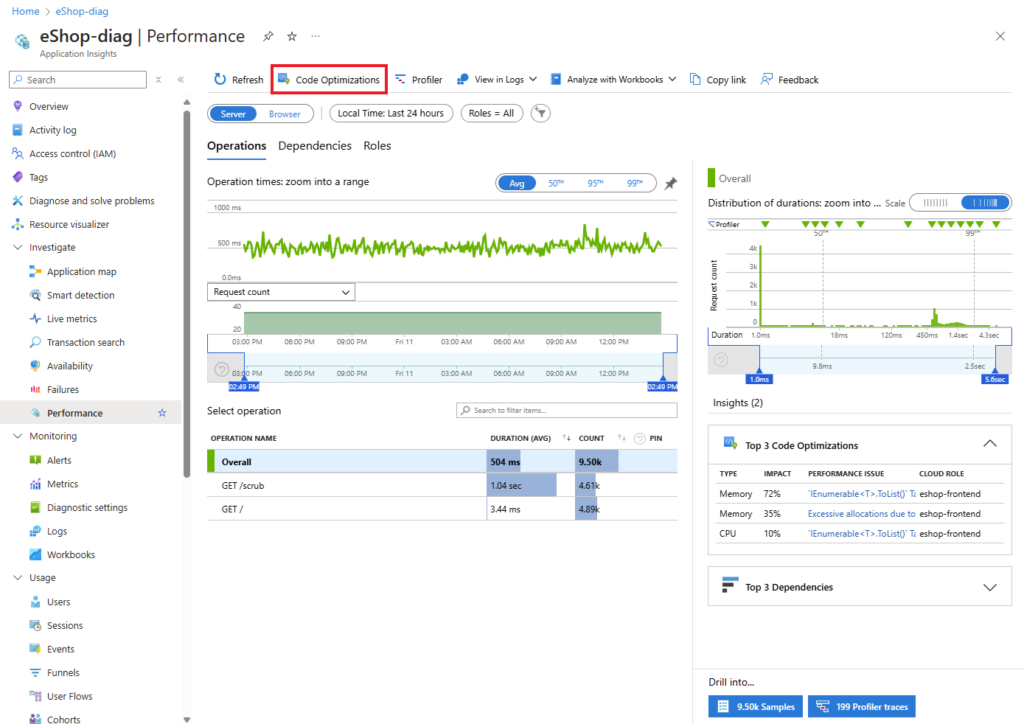
Seamless Integration into Development Workflows
Code Optimization is designed to fit naturally into existing development processes:
-
Task Management Integration: Recommendations can be exported as work items to Azure DevOps or other project tracking tools.
-
GitHub Copilot Support: Suggestions appear directly in Visual Studio and Visual Studio Code through GitHub Copilot, enabling developers to apply fixes with minimal effort.
-
Automated Task Assignment: GitHub Issues created from recommendations can be assigned to the Copilot agent, streamlining the optimization workflow.
Recent Enhancements
-
Analysis of Blocking Operations: The tool can now detect synchronous operations that block threads in asynchronous workflows. Previously, it only analyzed actively running threads.
-
Direct Copilot Task Assignment: GitHub Issues can now be assigned to the Copilot agent straight from the Code Optimization page or the snapshot debugger tab.
-
OpenTelemetry Support (Preview): Preliminary support for .NET profiling in OpenTelemetry allows developers to collect performance data without integrating additional SDKs.
Enabling Code Optimization
To start using Code Optimization, simply enable the .NET profiler for your application in Application Insights. For new apps, this option is available during the initial setup of monitoring.